 |
Hennepin County |
The U.S. Census Bureau calculates poverty based on a family's annual income in 1999 and raises the line defining poverty income for larger family sizes. Click here to view the poverty income levels by family size used in the 2000 U.S. census. For descriptions of terms see the U.S. Census Bureau Subject Definitions.
Click here for poverty and income tables for Minneapolis neighborhoods
Maps
Map of Median Household Income, Eastern Hennepin County, 1999 (in Adobe Acrobat PDF format--if you do not have a copy of the free Adobe Reader, click here.)
Map of Per Capita Income, Eastern Hennepin County, 1999 (PDF file)
Map of Persons Whose Family Income is 100% of Poverty or Below, Eastern Hennepin County, 1999 (PDF file)
Map of Persons Whose Family Income is 185% of Poverty or Below, Eastern Hennepin County, 1999 (PDF file)
Map of Children Age 11 and Under Below Poverty, Eastern Hennepin County, 1999 (PDF file)
Charts
Bar Chart on Percent of Population by Income Relative to Poverty, Minneapolis, 1989 and 1999
Bar Chart on Percent Below Poverty by Age Group, Minneapolis, Suburbs, and Hennepin County, 1999
Bar Chart of Percent of Children and Elderly Below Poverty, Hennepin County and Minneapolis, 1999
Bar Chart of Percent of Families Below Poverty by Family Type, Hennepin County and Minneapolis, 1999
Tables
Table of Children by Race and Poverty Status, Hennepin and Minneapolis Totals, 1999 *NEW
Downloadable Excel spreadsheets with detailed data on poverty levels
Percent of Children Below Poverty, Hennepin County and Minneapolis, 1999
|
Percent of Persons Below 1999 Poverty Level by Age |
||||||||||
|
Race |
Under 5 |
5 Years |
6 to 11 |
12 to 14 |
15 |
16 to 17 |
18 and Over |
All Ages |
Under 18 |
Children Under 18 |
|
White |
||||||||||
|
Minneapolis |
7.9% |
11.3% |
7.5% |
7.4% |
9.0% |
9.4% |
9.8% |
9.6% |
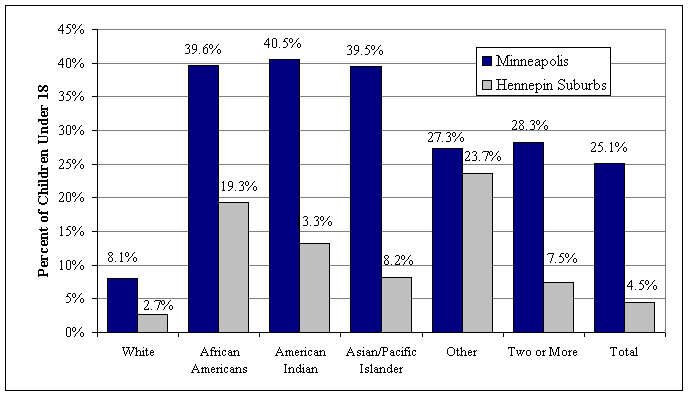
8.1% |
2,656 |
|
Hennepin County |
3.7% |
4.0% |
3.3% |
3.3% |
5.0% |
4.0% |
5.0% |
4.7% |
3.6% |
6,687 |
|
Hennepin County Suburbs |
2.5% |
2.5% |
2.5% |
2.6% |
4.2% |
3.0% |
3.0% |
2.9% |
2.7% |
4,031 |
|
African Americans |
||||||||||
|
Minneapolis |
42.2% |
42.5% |
39.5% |
39.4% |
36.7% |
33.5% |
27.0% |
31.7% |
39.6% |
9,631 |
|
Hennepin County |
34.4% |
33.8% |
33.4% |
33.4% |
30.2% |
30.2% |
22.7% |
26.6% |
33.2% |
11,777 |
|
Hennepin County Suburbs |
18.8% |
17.6% |
20.3% |
19.1% |
12.4% |
21.9% |
13.5% |
15.6% |
19.3% |
2,146 |
|
American Indian |
||||||||||
|
Minneapolis |
45.3% |
52.5% |
37.1% |
48.8% |
23.8% |
32.6% |
32.7% |
35.4% |
40.5% |
1,013 |
|
Hennepin County |
40.7% |
34.9% |
30.3% |
31.4% |
31.3% |
28.0% |
26.4% |
28.7% |
33.3% |
1,132 |
|
Hennepin County Suburbs |
22.2% |
13.6% |
11.2% |
0.0% |
55.3% |
12.7% |
11.2% |
11.9% |
13.3% |
119 |
|
Race |
Under 5 |
5 Years |
6 to 11 |
12 to 14 |
15 |
16 to 17 |
18 and Over |
All Ages |
Under 18 |
Children Under 18 |
| Asian | ||||||||||
|
Minneapolis |
35.4% |
46.1% |
42.6% |
41.3% |
35.4% |
32.6% |
27.1% |
31.9% |
39.5% |
3,578 |
|
Hennepin County |
19.1% |
26.3% |
26.5% |
27.2% |
22.0% |
20.7% |
14.9% |
18.0% |
23.9% |
4,326 |
|
Hennepin County Suburbs |
5.5% |
5.1% |
8.8% |
10.8% |
10.2% |
10.2% |
6.1% |
6.8% |
8.3% |
748 |
|
Pacific Islander |
||||||||||
|
Minneapolis |
0.0% |
100.0% |
47.8% |
0.0% |
0.0% |
57.1% |
14.0% |
20.3% |
39.5% |
34 |
|
Hennepin County |
0.0% |
50.0% |
31.4% |
0.0% |
0.0% |
44.4% |
10.5% |
14.1% |
26.4% |
34 |
|
Hennepin County Suburbs |
0.0% |
0.0% |
0.0% |
0.0% |
-- |
0.0% |
5.1% |
4.1% |
0.0% |
0 |
|
Other |
||||||||||
|
Minneapolis |
28.5% |
37.4% |
19.3% |
26.2% |
23.7% |
39.8% |
22.8% |
24.2% |
27.3% |
1,302 |
|
Hennepin County |
28.7% |
35.9% |
20.0% |
22.9% |
20.5% |
35.0% |
21.4% |
22.9% |
26.1% |
1,856 |
|
Hennepin County Suburbs |
29.2% |
32.3% |
21.1% |
17.2% |
11.4% |
13.1% |
17.8% |
19.8% |
23.7% |
554 |
|
Race |
Under 5 |
5 Years |
6 to 11 |
12 to 14 |
15 |
16 to 17 |
18 and Over |
All Ages |
Under 18 |
Children Under 18 |
| Two or More | ||||||||||
|
Minneapolis |
30.7% |
23.9% |
26.5% |
24.0% |
27.9% |
38.1% |
27.1% |
27.7% |
28.3% |
2,263 |
|
Hennepin County |
19.3% |
17.3% |
17.5% |
17.4% |
21.8% |
24.1% |
19.8% |
19.3% |
18.8% |
2,765 |
|
Hennepin County Suburbs |
7.1% |
10.4% |
7.0% |
6.8% |
12.8% |
7.4% |
8.6% |
8.0% |
7.5% |
502 |
|
Total Below Poverty |
||||||||||
|
Minneapolis |
24.6% |
28.8% |
25.2% |
25.3% |
24.1% |
24.2% |
14.6% |
16.9% |
25.1% |
20,477 |
|
Hennepin County |
11.3% |
11.9% |
10.8% |
10.4% |
10.9% |
10.0% |
7.5% |
8.3% |
10.9% |
28,577 |
|
Hennepin County Suburbs |
4.5% |
4.6% |
4.4% |
4.1% |
5.4% |
4.5% |
3.7% |
3.9% |
4.5% |
8,100 |
Percent of Children Below Poverty by Race, Minneapolis and Hennepin County Suburbs, 1999
Percent of
Individuals by Income Relative to the Poverty Line
Minneapolis, 1989 and 1999
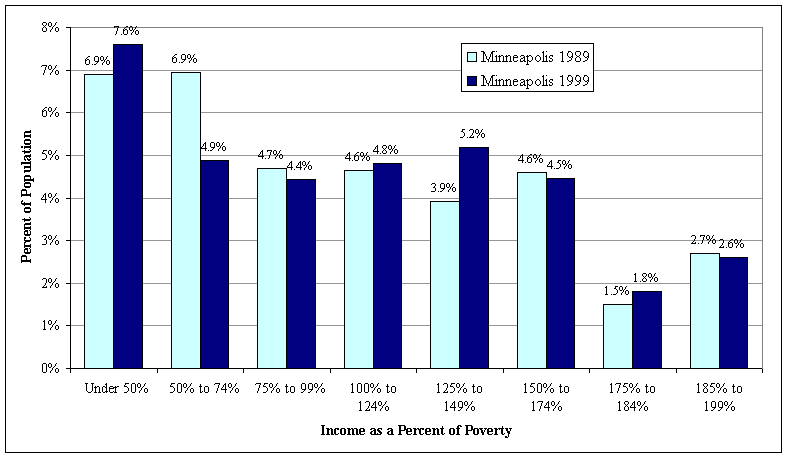
U.S. Census Bureau, 1990, STF3 Table P121; U.S. Census
Bureau 2000, SF3 Table P88
Prepared by: Hennepin County Department of Children, Family, and Adult
Services, 9/26/02
Percent
Change in Number of Persons by Income Range Relative to the Poverty Line
Minneapolis and Hennepin County
Suburbs, 1989 to 1999
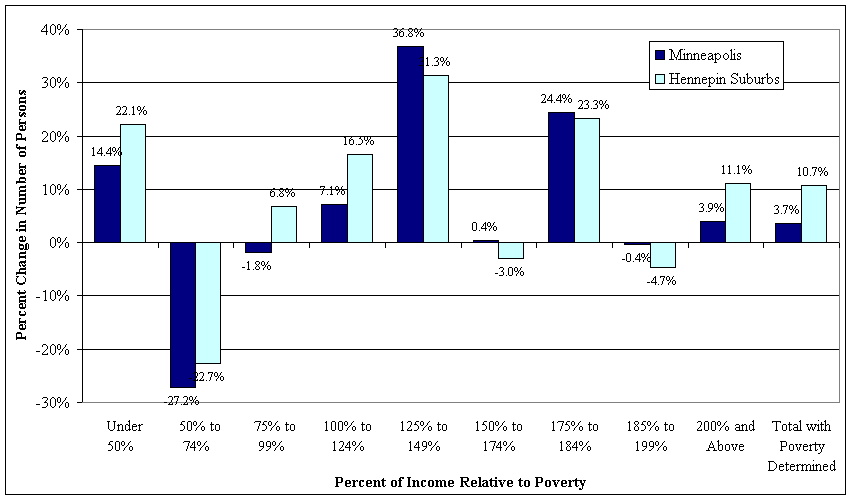
U.S. Census Bureau, 1990, STF3 Table P121; U.S. Census Bureau
2000, SF3 Table P88
Prepared by: Hennepin County Department of Children, Family, and Adult Services,
9/26/02
Percent
Below Poverty Line by Age Group
Minneapolis, Suburbs, and
Hennepin County, 1999
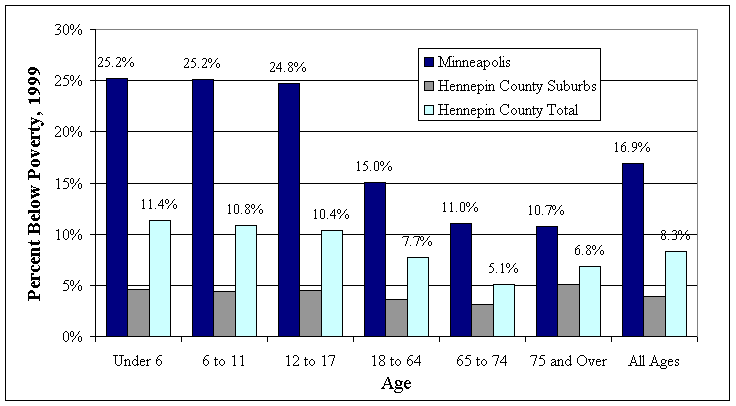
U.S. Census Bureau, 2000, SF3 Table P87
Prepared by: Hennepin County Department of Children, Family, and Adult
Services, 11/20/02
Percent of Individuals Below Poverty, 1999
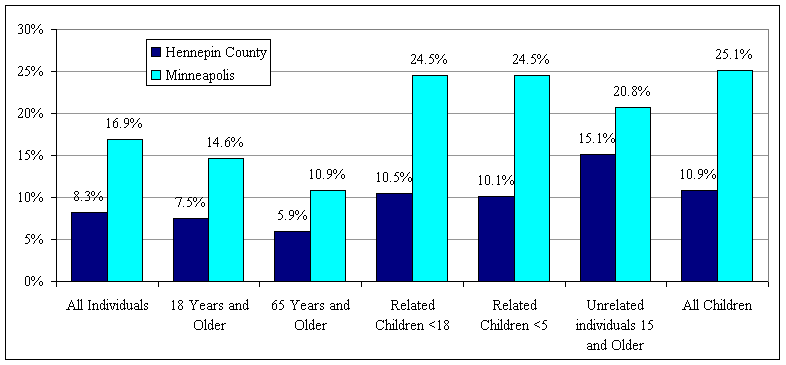
Source: U.S. Census 2000, Demographic Profile, June 11, 2002
Prepared by: Hennepin County Department of Children, Family, and Adult Services, June 19, 2002
Percent of
Families Below Poverty, 1999
For descriptions of terms see the
U.S. Census Bureau Subject Definitions.
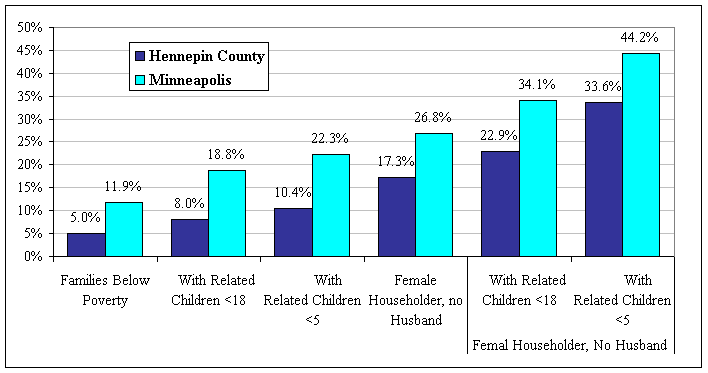
Source: U.S. Census 2000, Demographic Profile,
Prepared by: Hennepin County Department of Children, Family, and Adult Services, June 19, 2002
Population by
Poverty Status, 1999
For descriptions of terms see the
U.S. Census Bureau Subject Definitions.
| Number Below Poverty | Percent Below Poverty | |||||
|
Below Poverty in 1999 |
Hennepin County |
Minneapolis |
Hennepin Suburbs |
Hennepin County |
Minneapolis |
Hennepin Suburbs |
|
Families |
13,579 |
8,868 |
4,711 |
5.0% |
11.9% |
2.4% |
|
With Related* Children <18 |
11,245 |
7,614 |
3,631 |
8.0% |
18.8% |
3.7% |
|
With Related* Children <5 |
5,862 |
4,140 |
1,722 |
10.4% |
22.3% |
4.5% |
|
Female Householder, no Husband |
7,570 |
5,268 |
2,302 |
17.3% |
26.8% |
9.6% |
|
With Related Children <18 |
6,967 |
4,876 |
2,091 |
22.9% |
34.1% |
12.9% |
|
With Related Children <5 |
3,461 |
2,506 |
955 |
33.6% |
44.2% |
20.6% |
|
Individuals |
90,384 |
62,092 |
28,292 |
8.3% |
16.9% |
3.9% |
|
18 Years and Older |
61,807 |
41,615 |
20,192 |
7.5% |
14.6% |
3.7% |
|
65 Years and Older |
6,748 |
3,378 |
3,370 |
5.9% |
10.9% |
4.1% |
|
Related Children <18 |
27,373 |
19,851 |
7,522 |
10.5% |
24.5% |
4.2% |
|
Related Children <5 |
19,329 |
13,963 |
5,366 |
10.1% |
24.5% |
4.0% |
|
Unrelated individuals 15 and Older |
40,401 |
27,334 |
13,067 |
15.1% |
20.8% |
9.7% |
|
All Children |
28,577 |
20,477 |
8,100 |
10.9% |
25.1% |
4.5% |
|
Population for Whom Poverty Status is Determined (Above + Below)** |
Hennepin County |
Minneapolis |
Hennepin Suburbs |
|||
|
Families |
269,112 |
74,543 |
194,569 |
|||
|
With Related Children <18 |
139,803 |
40,595 |
99,208 |
|||
|
With Related Children <5 |
56,499 |
18,580 |
37,919 |
|||
|
Female Householder, no Husband |
43,739 |
19,668 |
24,071 |
|||
|
With Related Children <18 |
30,485 |
14,297 |
16,188 |
|||
|
With Related Children <5 |
10,310 |
5,666 |
4,644 |
|||
|
Individuals |
1,092,571 |
366,915 |
725,656 |
|||
|
18 Years and Older |
829,343 |
285,220 |
544,123 |
|||
|
65 Years and Older |
113,629 |
31,060 |
82,569 |
|||
|
Related Children <18 |
261,854 |
80,942 |
180,912 |
|||
|
Related Children <5 |
190,485 |
56,965 |
133,520 |
|||
|
Unrelated individuals 15 and Older |
267,077 |
131,697 |
135,380 |
|||
|
All Children |
263,228 |
81,695 |
181,533 |
|||
*Data for "related children" include children related to the
householder by birth, adoption, and marriage to a parent, but they exclude
non-relative foster children and spouses of householders under age 18.
**Persons living in group quarters (nursing homes,
dormitories, jails, etc.) are not included in poverty calculations.
Source: U.S. Census 2000, Demographic Profile, 2002
Prepared by: Hennepin County Department of Children, Family, and Adult Services, June 11, 2002
Median Household and Family Income, Per Capita Income, 1999
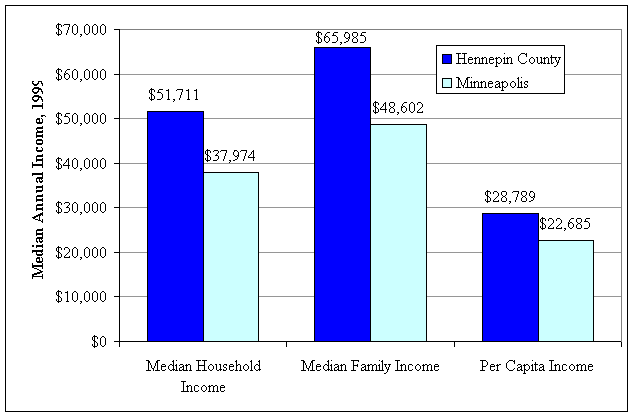
Source: U.S. Census 2000, Demographic Profile, 2002
Prepared by: Hennepin County Department of Children, Family, and Adult Services, June 19, 2002
Household and Family Income, 1999
|
Number of Households |
Percent of All Households | |||||
|
Annual Income for All Households, 1999 |
Hennepin County |
Minneapolis |
Hennepin Suburbs |
Hennepin County |
Minneapolis |
Hennepin Suburbs |
|
Less Than $10,000 |
27,349 |
17,543 |
9,806 |
6.0% |
10.8% |
3.3% |
|
$10,000 to $14,999 |
20,739 |
11,031 |
9,708 |
4.5% |
6.8% |
3.3% |
|
$15,000 to $24,999 |
46,677 |
23,063 |
23,614 |
10.2% |
14.2% |
8.0% |
|
$25,000 to $34,999 |
52,682 |
22,957 |
29,725 |
11.5% |
14.1% |
10.1% |
|
$35,000 to $49,999 |
71,365 |
27,374 |
43,991 |
15.6% |
16.9% |
15.0% |
|
$50,000 to $74,999 |
96,118 |
28,990 |
67,128 |
21.1% |
17.9% |
22.8% |
|
$75,000 to $99,999 |
59,579 |
14,607 |
44,972 |
13.1% |
9.0% |
15.3% |
|
$100,000 to $149,999 |
48,693 |
10,528 |
38,165 |
10.7% |
6.5% |
13.0% |
|
$150,000 to $199,999 |
14,708 |
2,821 |
11,887 |
3.2% |
1.7% |
4.0% |
|
$200,000 or More |
18,368 |
3,468 |
14,900 |
4.0% |
2.1% |
5.1% |
|
Median Household Income |
$51,711 |
$37,974 |
n/a |
|||
|
Number of Families |
Percent of All Families |
|||||
|
Annual Income for Families*, 1999 |
Hennepin County |
Minneapolis |
Hennepin Suburbs |
Hennepin County |
Minneapolis |
Hennepin Suburbs |
|
Less Than $10,000 |
8,129 |
5,308 |
2,821 |
3.0% |
7.1% |
1.4% |
|
$10,000 to $14,999 |
6,393 |
3,575 |
2,818 |
2.4% |
4.8% |
1.4% |
|
$15,000 to $24,999 |
17,216 |
8,076 |
9,140 |
6.4% |
10.8% |
4.7% |
|
$25,000 to $34,999 |
22,995 |
9,105 |
13,890 |
8.5% |
12.2% |
7.1% |
|
$35,000 to $49,999 |
37,570 |
12,254 |
25,316 |
14.0% |
16.4% |
13.0% |
|
$50,000 to $74,999 |
63,619 |
15,931 |
47,688 |
23.6% |
21.4% |
24.5% |
|
$75,000 to $99,999 |
45,440 |
8,948 |
36,492 |
16.9% |
12.0% |
18.8% |
|
$100,000 to $149,999 |
39,789 |
6,992 |
32,797 |
14.8% |
9.4% |
16.9% |
|
$150,000 to $199,999 |
12,372 |
1,954 |
10,418 |
4.6% |
2.6% |
5.4% |
|
$200,000 or More |
15,589 |
2,400 |
13,189 |
5.8% |
3.2% |
6.8% |
|
Median Family Income |
$65,985 |
$48,602 |
n/a |
|||
|
Per Capita Income |
$28,789 |
$22,685 |
n/a |
|||
*Family households do not include one-person households or
those composed of unrelated individuals.
Source: U.S. Census 2000, Demographic Profile, 2002
Prepared by: Hennepin County Department of Children, Family, and Adult Services, June 19, 2002
