  | 
    
     
Hennepin County  
Census
Data: Housing Costs and Family Size  | 


U.S. Census 2000,  Housing Costs, 
Owners and Renter, and Family Size 
     
     
Housing Costs 
     
        Bar chart  of selected owner costs as a 
        percentage of household income, Hennepin County and Minneapolis, 2000  
     
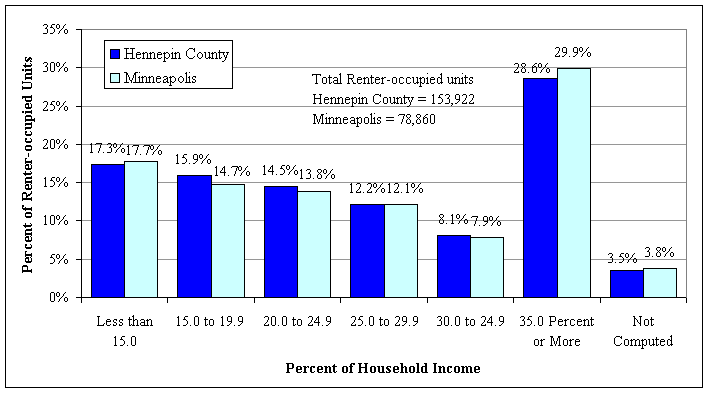
        Bar chart  of gross rent as a percentage of household 
        income, Hennepin County and Minneapolis, 2000  
     
        Table of total owner- and renter-occupied units 
        and housing costs as a percentage of household income in 1999, Hennepin 
        County, Minneapolis, and Hennepin County Suburbs  
     
        Bar chart on the change in renter households by 
        gross rent as a percentage of 
        household income, Hennepin County and Minneapolis, 1989 and 1999  
     
        Table on the change in number of households 
        by income spent for homeowner costs and rent, Hennepin County and 
        Minneapolis, 1989 and 1999  
     
        Table on the change in the percent of total 
        households by  income spent for homeowner costs and rent, Hennepin 
        County and Minneapolis, 1989 and 1999  
     
        Tenure and Family Size 
     
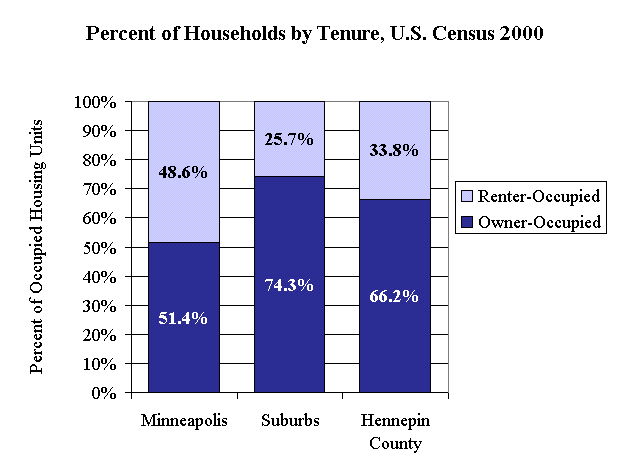
        Chart of percent home-owners and renters, Hennepin 
        County and Minneapolis, 2000 
     
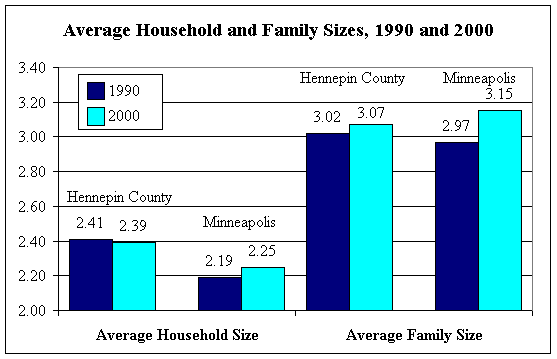
        Chart of average family and household sizes, Hennepin County and Minneapolis, 2000 
     
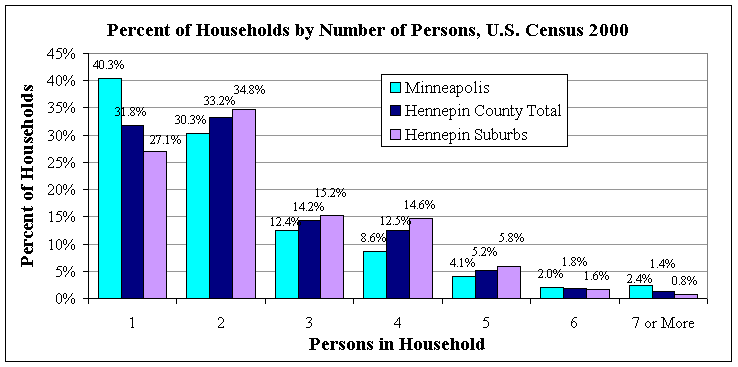
        Chart of number of persons in households, Hennepin County and Minneapolis, 2000 
     
        Table on percent 
        owner and renter occupied housedolds and by number of household members, 
        Minneapolis neighborhoods, 2000 
        Table
        on housing tenure and average household and family size, Hennepin County school districts, 2000 
        Map of average family size Hennepin County, 2000 
        (in Adobe Acrobat--if you do not have a copy of the free Adobe Reader, click
        here. ) 
        Map of percentage of 
        households owner occupied, Minneapolis, 2000  
         
        
        Downloadable Excel spreadsheets with 
        more detailed data on housing 
Selected Owner Costs 
as a Percentage of Household Income in 1999 
  
 Source: U.S. Census 2000, Demographic Profile, June 2002 
Prepared by: Hennepin County Department of Children, Family, and Adult Services, June 19, 2002 
      
Rent 
as a Percentage of Household Income in 1999 


For descriptions of terms see the
U.S. Census Bureau Subject Definitions.
 
 Source: U.S. Census 2000, Demographic Profile, June 2002 
Prepared by: Hennepin County Department of Children, Family, and Adult Services, June 19, 2002 


Owner- and Renter-Occupied Units 
and Housing Costs as a Percentage of Household Income in 1999 
      
  
     | 
    
     Selected Monthly Owner Costs as a Percentage of Household 
    Income in 1999  | 
   
  
    | Percentage of Income: | 
    
     Number of Owner Units  | 
    
     Percent of Total Owner Units  | 
   
  
    | 
     Owner-Occupied Units  | 
    
     Hennepin County  | 
    
     Minneapolis  | 
    
     Hennepin Suburbs  | 
    
     Hennepin County  | 
    
     Minneapolis  | 
    
     Hennepin Suburbs  | 
   
  
    | 
     Less than 15.0 Percent  | 
    
     95,185  | 
    
     24,334  | 
    
     70,851  | 
    
     36.2%  | 
    
     35.3%  | 
    
     36.5%  | 
   
  
    | 
     15.0 to 19.9 Percent  | 
    
     52,776  | 
    
     13,202  | 
    
     39,574  | 
    
     20.0%  | 
    
     19.1%  | 
    
     20.4%  | 
   
  
    | 
     20.0 to 24.9 Percent  | 
    
     40,480  | 
    
     9,914  | 
    
     30,566  | 
    
     15.4%  | 
    
     14.4%  | 
    
     15.7%  | 
   
  
    | 
     25.0 to 29.9 Percent  | 
    
     25,944  | 
    
     6,710  | 
    
     19,234  | 
    
     9.9%  | 
    
     9.7%  | 
    
     9.9%  | 
   
  
    | 
     30.0 to 24.9 Percent  | 
    
     15,264  | 
    
     4,181  | 
    
     11,083  | 
    
     5.8%  | 
    
     6.1%  | 
    
     5.7%  | 
   
  
    | 
     35.0 Percent or More  | 
    
     32,773  | 
    
     10,333  | 
    
     22,440  | 
    
     12.4%  | 
    
     15.0%  | 
    
     11.6%  | 
   
  
    | 
     Not Computed*  | 
    
     831  | 
    
     334  | 
    
     497  | 
    
     0.3%  | 
    
     0.5%  | 
    
     0.3%  | 
   
  
    | 
     Total Owner Units  | 
    
     263,253  | 
    
     69,008  | 
    
     194,245  | 
     | 
     | 
     | 
   
  
     | 
     | 
     | 
     | 
     | 
     | 
     | 
   
  
    | Percentage of Income: | 
    
     Gross Rent as a Percentage of Household Income in 1999  | 
   
  
    | 
     Renter-Occupied Units  | 
    
     Number of Renter Units  | 
    
     Percent of Total Renter Units  | 
   
  
    | 
     Less than 15.0 Percent  | 
    
     26,665  | 
    
     13,969  | 
    
     12,696  | 
    
     17.3%  | 
    
     17.7%  | 
    
     16.9%  | 
   
  
    | 
     15.0 to 19.9 Percent  | 
    
     24,457  | 
    
     11,613  | 
    
     12,844  | 
    
     15.9%  | 
    
     14.7%  | 
    
     17.1%  | 
   
  
    | 
     20.0 to 24.9 Percent  | 
    
     22,335  | 
    
     10,919  | 
    
     11,416  | 
    
     14.5%  | 
    
     13.8%  | 
    
     15.2%  | 
   
  
    | 
     25.0 to 29.9 Percent  | 
    
     18,710  | 
    
     9,552  | 
    
     9,158  | 
    
     12.2%  | 
    
     12.1%  | 
    
     12.2%  | 
   
  
    | 
     30.0 to 24.9 Percent  | 
    
     12,453  | 
    
     6,216  | 
    
     6,237  | 
    
     8.1%  | 
    
     7.9%  | 
    
     8.3%  | 
   
  
    | 
     35.0 Percent or More  | 
    
     43,958  | 
    
     23,594  | 
    
     20,364  | 
    
     28.6%  | 
    
     29.9%  | 
    
     27.1%  | 
   
  
    | 
     Not Computed*  | 
    
     5,344  | 
    
     2,997  | 
    
     2,347  | 
    
     3.5%  | 
    
     3.8%  | 
    
     3.1%  | 
   
  
    | 
     Total Renter Units  | 
    
     153,922  | 
    
     78,860  | 
    
     75,062  | 
     | 
     | 
     | 


For descriptions of terms see the
U.S. Census Bureau Subject Definitions.  
      
*Percent of income is not computed for households with no 
income or negative income or paid no cash rent. 
Source: U.S. Census 2000, Demographic Profile, June 2002 
Prepared by: Hennepin County Department of Children, Family, and Adult Services, 
June 13, 2002 


      Percent Change in 
      the Number of Renter Households by Proportion of Annual Income for Gross 
      Rent, Hennepin County and Minneapolis, 1989 and 1999 


      Change in Owner- and 
      Renter-Occupied Units by the Percentage of Household Income Spent on 
      Housing Costs, 1989 to 1999 
  
    | 
     Owner-Occupied Households  | 
    
    Change in Number of Owner Households, 
    1989-1999 | 
    
    Percentage Change in Number of Owner 
    Households | 
   
  
    | 
     Percent of Income for Ownership Costs  | 
    
     Hennepin County  | 
    
     Minneapolis  | 
    
     Hennepin County  | 
    
     Minneapolis  | 
   
  
    | 
     Less than 20 percent  | 
    
     23,220  | 
    
     266  | 
    
     18.6%  | 
    
     0.7%  | 
   
  
    | 
     20 to 24 percent  | 
    
     1,294  | 
    
     -521  | 
    
     3.3%  | 
    
     -5.0%  | 
   
  
    | 
     25 to 29 percent  | 
    
     -846  | 
    
     -380  | 
    
     -3.2%  | 
    
     -5.4%  | 
   
  
    | 
     30 to 34 percent  | 
    
     337  | 
    
     305  | 
    
     2.3%  | 
    
     7.9%  | 
   
  
    | 
     35 percent or more  | 
    
     8,057  | 
    
     2,779  | 
    
     32.6%  | 
    
     36.8%  | 
   
  
    | 
     Not computed*  | 
    
     218  | 
    
     76  | 
    
     35.6%  | 
    
     29.5%  | 
   
  
    | 
     Total  | 
    
     32,280  | 
    
     2,525  | 
    
     14.0%  | 
    
     3.8%  | 


    | Renter-Occupied Households | 
    
    
     Change in Number of Renter Households, 1989-1999  | 
    
    
     Percentage Change in Number of Renter Households  | 
   
  
    | 
     Percent of Income for Rent  | 
    
     Hennepin County  | 
    
     Minneapolis  | 
    
     Hennepin County  | 
    
     Minneapolis  | 
   
  
    | 
     Less than 20 percent  | 
    
     9,893  | 
    
     5,690  | 
    
     24.0%  | 
    
     28.6%  | 
   
  
    | 
     20 to 24 percent  | 
    
     -2,708  | 
    
     -1,257  | 
    
     -10.8%  | 
    
     -10.3%  | 
   
  
    | 
     25 to 29 percent  | 
    
     -2,229  | 
    
     -1,265  | 
    
     -10.6%  | 
    
     -11.7%  | 
   
  
    | 
     30 to 34 percent  | 
    
     -2,220  | 
    
     -1,703  | 
    
     -15.1%  | 
    
     -21.5%  | 
   
  
    | 
     35 percent or more  | 
    
     -3,816  | 
    
     -4,504  | 
    
     -8.0%  | 
    
     -16.0%  | 
   
  
    | 
     Not computed*  | 
    
     2,062  | 
    
     1,200  | 
    
     62.8%  | 
    
     66.8%  | 
   
  
    | 
     Total  | 
    
     982  | 
    
     -1,839  | 
    
     0.6%  | 
    
     -2.3%  | 


      *Percent of income is not computed for households with no 
income or negative income or paid no cash rent. 
Source: U.S. Census 2000, Demographic Profile, June 2002 
Prepared by: Hennepin County Department of Children, Family, and Adult Services, 
June 20, 2002 


      Percent of Total 
      Owner- and Renter-Occupied Units by the Percentage of Household Income 
      Spent on Housing Costs, 1989 to 1999 
  
     | 
    
    Owner-Occupied Households | 
    
     Owner-Occupied Households  | 
   
  
     | 
    
    Percent of Total | 
    
    Percent of Total | 
    
     Change in Percent of Total  | 
   
  
    | Percent of 
    Income | 
    
     Hennepin County  | 
    
    Minneapolis | 
    
     Hennepin County  | 
    
     Minneapolis  | 
   
  
    | 
     For Ownership Costs  | 
    
     1989  | 
    
     1999  | 
    
     1989  | 
    
     1999  | 
    
     1989 -1999  | 
    
     1989 -1999  | 
   
  
    | 
     Less than 20 percent  | 
    
     54.0%  | 
    
     56.2%  | 
    
     56.1%  | 
    
     54.4%  | 
    
     2.2%  | 
    
     -1.7%  | 
   
  
    | 
     20 to 24 percent  | 
    
     17.0%  | 
    
     15.4%  | 
    
     15.7%  | 
    
     14.4%  | 
    
     -1.6%  | 
    
     -1.3%  | 
   
  
    | 
     25 to 29 percent  | 
    
     11.6%  | 
    
     9.9%  | 
    
     10.7%  | 
    
     9.7%  | 
    
     -1.7%  | 
    
     -0.9%  | 
   
  
    | 
     30 to 34 percent  | 
    
     6.5%  | 
    
     5.8%  | 
    
     5.8%  | 
    
     6.1%  | 
    
     -0.7%  | 
    
     0.2%  | 
   
  
    | 
     35 percent or more  | 
    
     10.7%  | 
    
     12.4%  | 
    
     11.4%  | 
    
     15.0%  | 
    
     1.7%  | 
    
     3.6%  | 
   
  
    | 
     Not computed*  | 
    
     0.3%  | 
    
     0.3%  | 
    
     0.4%  | 
    
     0.5%  | 
    
     0.1%  | 
    
     0.1%  | 
   
  
    | 
     Total  | 
    
     100.0%  | 
    
     100.0%  | 
    
     100.0%  | 
    
     100.0%  | 
    
     n/a  | 
    
     n/a  | 


     | 
    
    Renter-Occupied Households | 
    
     Renter-Occupied Households  | 
   
  
     | 
    
     Percent of Total  | 
    
     Percent of Total  | 
    
     Change in Percent of Total  | 
   
  
    | Percent of 
    Income | 
    
     Hennepin County  | 
    
     Minneapolis  | 
    
     Hennepin County  | 
    
     Minneapolis  | 
   
  
    | 
     For Rent  | 
    
     1989  | 
    
     1999  | 
    
     1989  | 
    
     1999  | 
    
     1989 -1999  | 
    
     1989 -1999  | 
   
  
    | 
     Less than 20 percent  | 
    
     27.0%  | 
    
     33.2%  | 
    
     24.6%  | 
    
     32.4%  | 
    
     6.3%  | 
    
     7.8%  | 
   
  
    | 
     20 to 24 percent  | 
    
     16.4%  | 
    
     14.5%  | 
    
     15.1%  | 
    
     13.8%  | 
    
     -1.9%  | 
    
     -1.2%  | 
   
  
    | 
     25 to 29 percent  | 
    
     13.7%  | 
    
     12.2%  | 
    
     13.4%  | 
    
     12.1%  | 
    
     -1.5%  | 
    
     -1.3%  | 
   
  
    | 
     30 to 34 percent  | 
    
     9.6%  | 
    
     8.1%  | 
    
     9.8%  | 
    
     7.9%  | 
    
     -1.5%  | 
    
     -1.9%  | 
   
  
    | 
     35 percent or more  | 
    
     31.2%  | 
    
     28.6%  | 
    
     34.8%  | 
    
     29.9%  | 
    
     -2.7%  | 
    
     -4.9%  | 
   
  
    | 
     Not computed*  | 
    
     2.1%  | 
    
     3.5%  | 
    
     2.2%  | 
    
     3.8%  | 
    
     1.3%  | 
    
     1.6%  | 
   
  
    | 
     Total  | 
    
     100.0%  | 
    
     100.0%  | 
    
     100.0%  | 
    
     100.0%  | 
    
     n/a  | 
    
     n/a  | 


*Percent of income is not computed for households with no 
income or negative income or paid no cash rent. 
Source: U.S. Census 2000, Demographic Profile, June 2002 
Prepared by: Hennepin County Department of Children, Family, and Adult Services, 
June 13, 2002 


      Percent Owners 
      and Renters 
  
Source: U.S. Census 2000, Summary File 1; Produced by Hennepin County Children, Families and Adults,
September 26, 2001 
Family Size 
  
Persons in 
Households, 2000 
  
Source: U.S. Census 1990 and 2000, Summary File 1; Produced by Hennepin County Children, Families and Adults,
December 11, 2001 
       |