 |
Hennepin County |
U.S. Census 2000, Tables, Maps, and Charts: Persons who chose Hispanic or Latino ethnicity, which is counted separately from race (click here to racial composition page).
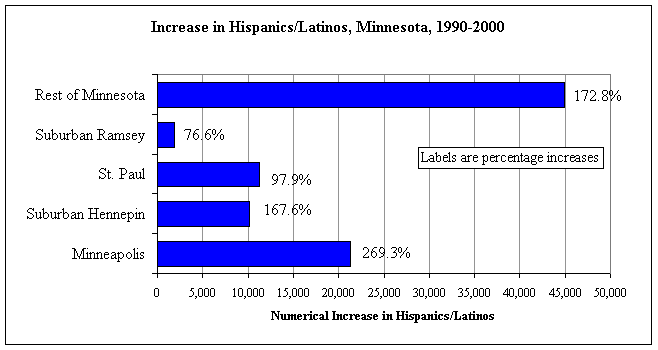
Bar chart on change in Hispanics/Latinos in Minnesota, 1990-2000
Table on change in Hispanics/Latinos in Minnesota, 1990-2000
Table on change in Hispanic/Latino age groups, Hennepin County and Minneapolis, 1990-2000
Table on Hispanics/Latinos as a percent of total population, Minneapolis neighborhoods, 2000
Table on age groups of Hispanics/Latinos, Hennepin County school districts, 2000
Table on age groups of Hispanics/Latinos, Minneapolis neighborhoods, 2000
Map of Hispanic/Latino persons per square mile, Eastern Hennepin County, 2000 (in Adobe Acrobat--if you do not have a copy of the free Adobe Reader, click here. )
Map of Hispanic/Latino children age 0 to 4 per square mile, Minneapolis, 2000 (in Adobe Acrobat)
Map of Hispanic/Latino children age 0-17 as a percent of total children, Hennepin County, 2000 (html format)
Dot map of Hispanic/Latino persons, Minneapolis, 2000 (in Adobe Acrobat)
Downloadable Excel spreadsheets with more detailed data on Hispanics/Latinos

Source: U.S. Census 2000, Public Law 94-171 and Summary File 1; Produced by Hennepin County Children, Families and Adults, September 25, 2001
