 |
Hennepin County |
Click here for data about foreign born population or languages spoken in Hennepin County cities published by the Office of Planning and Development. For descriptions of terms see the U.S. Census Bureau Subject Definitions (in Adobe Acrobat PDF format).
Note: The socio-economic data for Minneapolis neighborhoods may not be absolutely precise because they are totals of small census areas called "block groups". A few of these block groups do not align exactly with neighborhood boundaries. Most discrepancies are very minor except for the Hawthorne-Jordan border. Census block groups aggregated for Jordan in these tables include a four-block area lying within Hawthorne. Therefore, numerical counts for Jordan are slightly higher and counts for Hawthorne are slightly lower than actual populations. Percentages and rates may be slightly higher or lower than the precise neighborhood areas. In general, the socio-economic figures for all areas are not exact because they are calculated for the whole population from the long-form census questionnaires sent to one-sixth of households in April 2000.
Migration and Foreign Born
Pie Charts of Population by Place of Birth, Hennepin County and Minneapolis, 2000
Pie Charts of Foreign Born by Region of Birth, Hennepin County and Minneapolis, 2000
Map of Total Population, Foreign Born by and Entered U.S. 1995 to March 2000, Eastern Hennepin County (in Adobe Acrobat PDF format--if you do not have a copy of the free Adobe Reader, click here.)
Table of Population Age 5 and Over by Place of Residence in 1995, Minneapolis Neighborhoods
Table of Percent of Total Population by Place of Birth, Minneapolis Neighborhoods, 2000
Language Spoken at Home
Table of Persons 5 Years and Older, Detailed Languages Spoken at Home, Hennepin County, 2000
Table of Persons 5 Years and Older, Detailed Languages Spoken at Home, Minneapolis, 2000
Downloadable spreadsheets with census data about foreign born population and language spoken at home
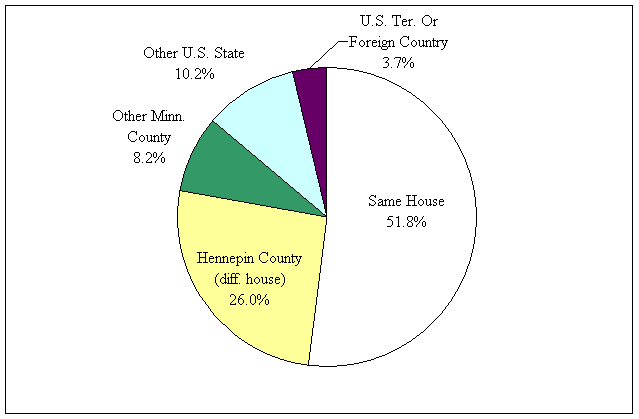
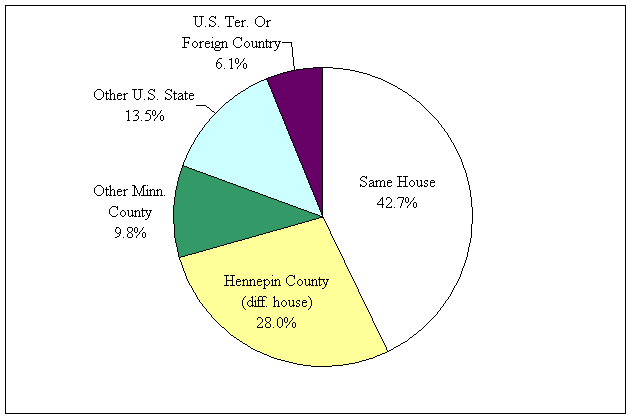
Percent of Population Age 5 and Older by Place of Residence in 1995 and 2000
Place of Residence in 1995, Hennepin
County Persons Age 5 and Over in 2000
Total = 1,043,809
Place of Residence in 1995, Minneapolis
Persons Age 5 and Over in 2000
Total = 357,867
Percent of Total Population by Place of Birth and Citizenship, 2000
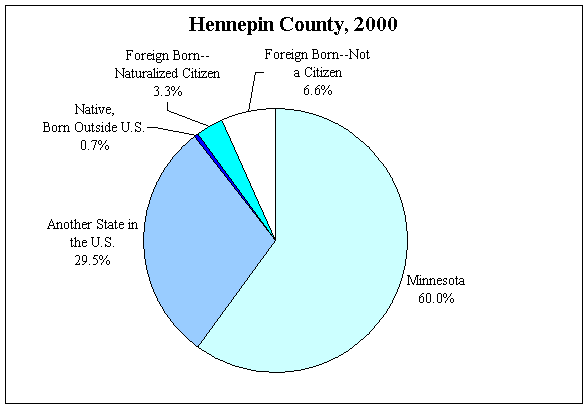
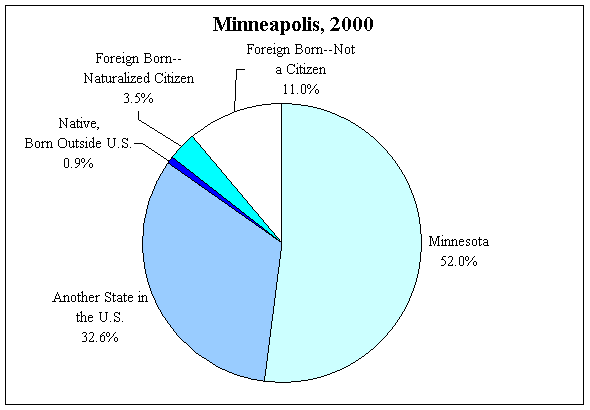
Note: Persons born outside the U.S. in Puerto Rico and other U.S. territories
are considered "native born" but not foreign born.
Source: U.S. Census 2000, Demographic Profile, June 2002
Prepared by: Hennepin County Department of Children, Family, and Adult Services, June 13, 2002
Percent of Foreign Born by Region of Birth, 2000
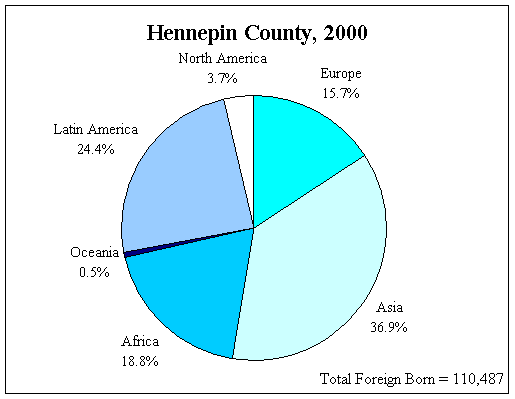
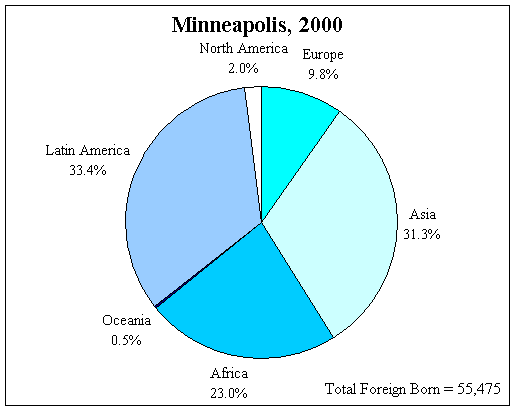
Source: U.S. Census 2000, Demographic Profile, June 2002
Prepared by: Hennepin County Department of Children, Family, and Adult Services, June 13, 2002
Percent of Population 5 Years and Older, Language Spoken at Home, 2000
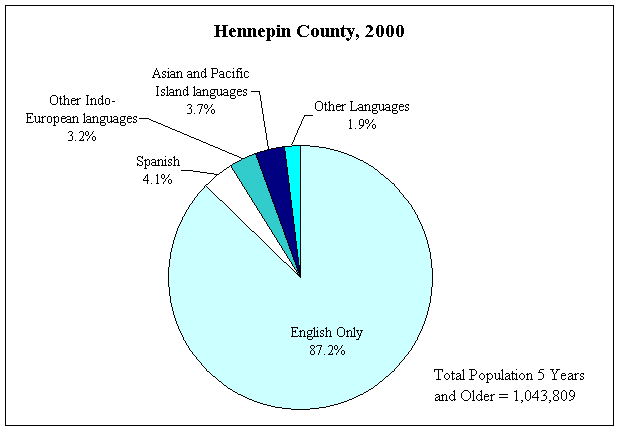
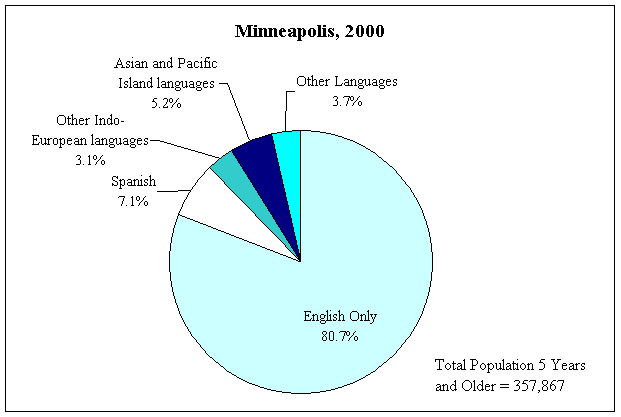
Source: U.S. Census 2000, Demographic Profile, June 2002
Prepared by: Hennepin County Department of Children, Family, and Adult Services, June 12, 2002
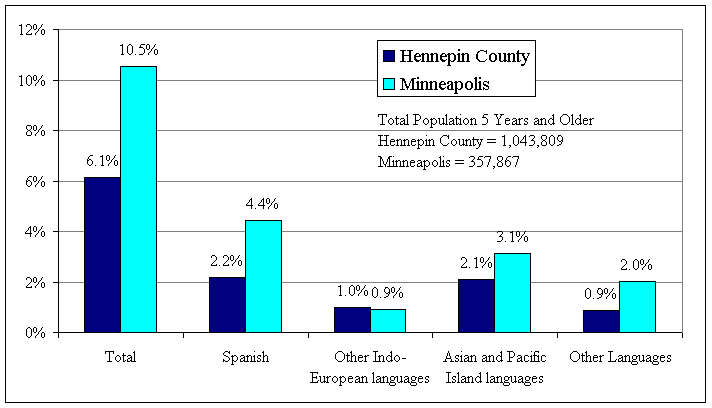
Percent of
Population 5 Years and Older, Language Spoken at Home and Speaking English Less
Than "Very Well", 2000
For descriptions of terms see the
U.S. Census Bureau Subject Definitions.
(Language spoken at home is defined on page six.)
Source: U.S. Census 2000, Demographic Profile, June 2002
Prepared by: Hennepin County Department of Children, Family, and Adult Services, June 12, 2002
Place of Birth and Citizenship, 2000
|
Hennepin County |
Minneapolis |
Hennepin Suburbs |
Hennepin County |
Minneapolis |
Hennepin Suburbs |
|
|
Total Population |
1,116,200 |
382,452 |
733,748 |
Percent of Total Population | ||
|
Native |
1,005,704 |
326,977 |
678,727 |
90.1% |
85.5% |
92.5% |
|
Born in U.S. |
998,371 |
323,637 |
674,734 |
89.4% |
84.6% |
92.0% |
|
Minnesota |
669,610 |
198,925 |
470,685 |
60.0% |
52.0% |
64.1% |
|
Different State |
328,761 |
124,712 |
204,049 |
29.5% |
32.6% |
27.8% |
|
Born Outside U.S.* |
7,333 |
3,340 |
3,993 |
0.7% |
0.9% |
0.5% |
|
Foreign Born |
110,496 |
55,475 |
55,021 |
9.9% |
14.5% |
7.5% |
|
Entered March 1990 to March 2000 |
66,843 |
37,476 |
29,367 |
6.0% |
9.8% |
4.0% |
|
Naturalized Citizen |
36,519 |
13,508 |
23,011 |
3.3% |
3.5% |
3.1% |
|
Not a Citizen |
73,977 |
41,967 |
32,010 |
6.6% |
11.0% |
4.4% |
|
Foreign Born by Region |
Percent of Foreign Born |
|||||
|
Total** |
110,487 |
55,475 |
55,012 |
100.0% |
100.0% | 100.0% |
|
Europe |
17,363 |
5,409 |
11,954 |
15.7% |
9.8% |
21.7% |
|
Asia |
40,762 |
17,376 |
23,386 |
36.9% |
31.3% |
42.5% |
|
Africa |
20,735 |
12,765 |
7,970 |
18.8% |
23.0% |
14.5% |
|
Oceania |
567 |
277 |
290 |
0.5% |
0.5% |
0.5% |
|
Latin America |
26,994 |
18,540 |
8,454 |
24.4% |
33.4% |
15.4% |
|
North America |
4,066 |
1,108 |
2,958 |
3.7% |
2.0% |
5.4% |
*Note: Persons born in Puerto Rico and other U.S. territories
are considered "native born" but not foreign born.
**Excludes born at sea.
Source: U.S. Census 2000, Demographic Profile, June 2002
Prepared by: Hennepin County Department of Children, Family, and Adult Services, June 11, 2002
Population 5
Years and Older, Language Spoken at Home, 2000
For descriptions of terms see the
U.S. Census Bureau Subject Definitions.
(Language spoken at home is defined on page six.)
|
Population 5 Years and Older |
Percent of 5 Years and Older |
|||||
|
Language Spoken at Home |
Hennepin County |
Minneapolis |
Hennepin Suburbs |
Hennepin County |
Minneapolis |
Hennepin Suburbs |
|
Total 5 and Older |
1,043,809 |
357,867 |
685,942 |
100.0% |
100.0% |
100.0% |
|
English Only |
909,793 |
288,932 |
620,861 |
87.2% |
80.7% |
90.5% |
|
Language Other Than English |
134,016 |
68,935 |
65,081 |
12.8% |
19.3% |
9.5% |
|
Speak English Less Than "very well" |
64,156 |
37,693 |
26,463 |
6.1% |
10.5% |
3.9% |
|
Spanish |
42,540 |
25,579 |
16,961 |
4.1% |
7.1% |
2.5% |
|
Speak English Less Than "very well" |
22,866 |
15,912 |
6,954 |
2.2% |
4.4% |
1.0% |
|
Other Indo-European languages |
32,974 |
11,245 |
21,729 |
3.2% |
3.1% |
3.2% |
|
Speak English Less Than "very well" |
10,259 |
3,309 |
6,950 |
1.0% |
0.9% |
1.0% |
|
Asian and Pacific Island languages |
38,401 |
18,782 |
19,619 |
3.7% |
5.2% |
2.9% |
|
Speak English Less Than "very well" |
21,753 |
11,193 |
10,560 |
2.1% |
3.1% |
1.5% |
|
Other Languages |
20,101 |
13,329 |
6,772 |
1.9% |
3.7% |
1.0% |
|
Speak English Less Than "very well" |
9,278 |
7,279 |
1,999 |
0.9% |
2.0% |
0.3% |
Source: U.S. Census 2000, Demographic Profile, June 2002
Prepared by: Hennepin County Department of Children, Family, and Adult Services, June 13, 2002
